Master the Debt to Equity Ratio Formula and Make Smarter Financial Decisions in 2026

Introduction
Have you ever looked at a company’s financials and felt completely lost? You are not alone. Most people skip straight past the balance sheet because it looks intimidating. But buried inside that sheet is one of the most powerful numbers in finance.
The debt to equity ratio formula is the tool that investors, lenders, and business owners use to figure out how risky a company really is. It tells you, in a single number, whether a business is leaning too hard on borrowed money or standing on its own financial feet.
In this article, you will learn exactly what the debt to equity ratio formula means, how to calculate it step by step, how to read the results, and how to use it to make smarter money decisions. Whether you are analyzing stocks, running a business, or studying finance, this guide covers everything you need.
What Is the Debt to Equity Ratio?
The debt to equity ratio (D/E ratio) is a financial metric that compares how much a company owes to how much it actually owns. It shows the relationship between borrowed capital and shareholder capital.
Think of it this way. If your friend borrowed $90,000 to buy a $100,000 car and paid $10,000 from savings, their “debt to equity” would be 9. That is a very leveraged position. The same logic applies to companies.
The higher the ratio, the more a company depends on debt. The lower the ratio, the more it relies on its own money. Neither extreme is always good or bad. Context is everything.
The Debt to Equity Ratio Formula
Here is the core formula you need to know:

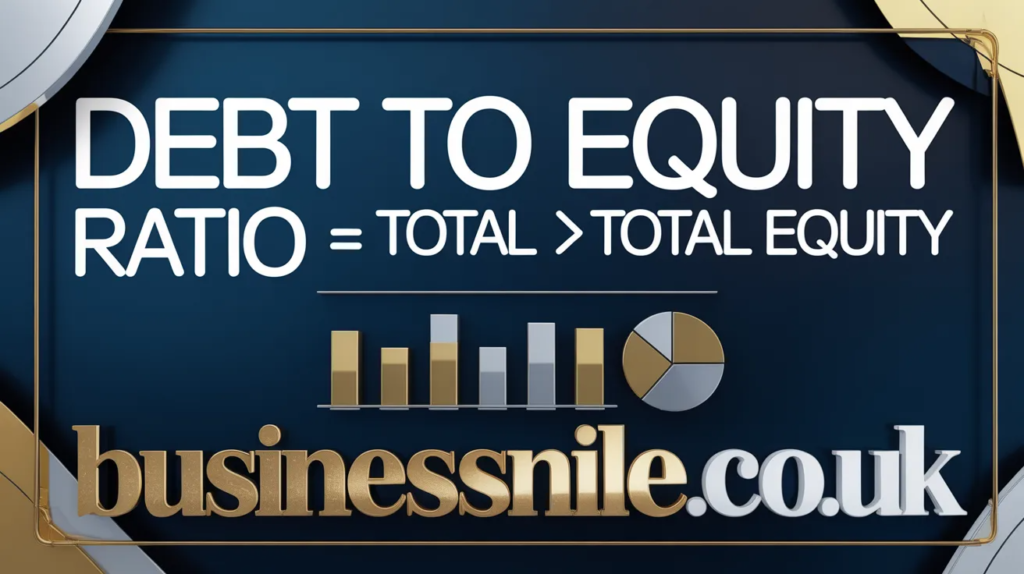
Debt to Equity Ratio = Total Liabilities / Total Shareholders’ Equity
That is it. Two numbers from the balance sheet, and you get a clear picture of a company’s financial structure.
Breaking Down Each Component
Total Liabilities includes everything a company owes:
- Short-term debt (due within a year)
- Long-term debt (loans, bonds, mortgages)
- Accounts payable
- Deferred revenue
- Accrued expenses
Total Shareholders’ Equity includes everything the owners actually own:
- Common stock
- Retained earnings
- Additional paid-in capital
- Treasury stock (subtracted)
You find both numbers on the balance sheet. They are always listed clearly.
How to Calculate the Debt to Equity Ratio: Step by Step
Let me walk you through a real example so this clicks instantly.
Step 1: Find Total Liabilities
You open a company’s balance sheet and see:
- Short-term debt: $50,000
- Long-term debt: $200,000
- Accounts payable: $30,000
- Other liabilities: $20,000
Total Liabilities = $300,000
Step 2: Find Total Shareholders’ Equity
- Common stock: $100,000
- Retained earnings: $150,000
Total Shareholders’ Equity = $250,000
Step 3: Apply the Debt to Equity Ratio Formula
D/E Ratio = $300,000 / $250,000 = 1.2
This means the company has $1.20 of debt for every $1.00 of equity. That is a moderate level of leverage. Not alarming, but worth watching.
What Does the Result Actually Mean?
Once you calculate the ratio, you need to interpret it correctly. Here is a quick guide:
| D/E Ratio | What It Suggests |
|---|---|
| Below 1.0 | More equity than debt. Generally safer. |
| Around 1.0 | Equal debt and equity. Balanced. |
| 1.0 to 2.0 | Moderate leverage. Common in many industries. |
| Above 2.0 | High leverage. Could signal financial risk. |
| Negative | Rare. Means negative equity. Often a red flag. |
Keep in mind that these ranges are not universal. What counts as “high” depends heavily on the industry.
Industry Benchmarks: Why Context Matters
A D/E ratio of 3.0 might seem alarming at first. But for a utility company or a real estate firm, it can be completely normal.
Here is why. Capital-intensive industries often take on huge amounts of debt to fund infrastructure, equipment, or property. They have stable, predictable cash flows that make lenders comfortable. So a higher ratio is acceptable.
On the other hand, a tech startup with a D/E ratio of 3.0 would raise serious red flags. Technology companies typically do not need much physical infrastructure. If they are borrowing that heavily, something might be off.
Typical D/E ratios by industry:
- Utilities: 1.5 to 2.5
- Real Estate: 1.5 to 3.0
- Manufacturing: 0.5 to 1.5
- Technology: 0.2 to 0.8
- Retail: 0.5 to 1.5
- Financial Services: Can exceed 10 (they use debt as a core business tool)
Always compare a company’s ratio to others in the same industry. Comparing a bank to a software firm using the same D/E benchmark makes zero sense.
Why Investors Care So Much About This Ratio
Investors use the debt to equity ratio formula as a first filter. Before they dive deep into a company, they want to know how the business is funded.
High debt means higher fixed obligations. The company must make interest payments no matter how business is going. In a downturn, that pressure can become crushing.
Here is what Warren Buffett has said about debt: he prefers companies that can operate and grow without heavy borrowing. That philosophy is rooted in exactly this kind of ratio analysis.
Lenders also use this formula before approving credit. A company with a D/E ratio of 4.0 will find it much harder and more expensive to borrow than one with a ratio of 0.8. Higher perceived risk means higher interest rates.
The Debt to Equity Ratio Formula for Personal Finance
Here is something most articles skip. You can apply this same formula to your own finances.
Your “total liabilities” would include your mortgage, car loans, student loans, and credit card debt. Your “equity” would be your net worth, meaning what you own minus what you owe.
If you have $200,000 in debt and $100,000 in assets, your personal D/E ratio is 2.0. That tells you your financial position leans heavily on borrowed money. This kind of self-check can be genuinely eye-opening.
I ran this calculation on my own finances a few years ago. It was uncomfortable to see the number, but it motivated me to pay down debt faster than I otherwise would have.
Variations of the Debt to Equity Ratio Formula
Not every analyst uses the same version of this formula. Here are a few common variations:
1. Long-Term Debt to Equity Ratio
Formula: Long-Term Debt / Total Shareholders’ Equity
This version focuses only on long-term obligations. It removes short-term liabilities, which gives a clearer view of the company’s long-term financial structure. Many analysts prefer this version for capital-heavy industries.
2. Debt to Equity Ratio Using Market Value
Formula: Market Value of Debt / Market Value of Equity
Instead of using book values from the balance sheet, this version uses market prices. It is more forward-looking but also harder to calculate since market debt values are not always published.
3. Total Debt to Equity
This version includes only interest-bearing debt (loans and bonds) rather than all liabilities. It strips out operational items like accounts payable and focuses purely on financial debt.
Each version has its place. For most general analysis, the standard formula using total liabilities works well.
Limitations of the Debt to Equity Ratio Formula
No formula is perfect. The debt to equity ratio formula has real blind spots you should know about.
It ignores cash flows. A company with a D/E ratio of 2.0 but massive cash generation is far safer than one with a D/E ratio of 1.0 and shrinking revenue. The ratio alone does not tell you that.
Accounting differences distort comparisons. Different companies use different accounting methods. One firm might lease assets (keeping them off the balance sheet) while another buys them outright with borrowed money. The ratios will look very different even if the economic reality is similar.
Negative equity creates confusion. If a company has negative shareholders’ equity (due to large losses or buybacks), the formula produces a negative ratio. That number is basically meaningless. You need other metrics to assess such companies.
It is a snapshot. The ratio only reflects a moment in time. A company could have a healthy D/E ratio today and take on massive debt tomorrow. Always track the trend over multiple periods.
Use the debt to equity ratio formula alongside other metrics like the interest coverage ratio, current ratio, and return on equity for a fuller picture.
How to Use This Ratio When Analyzing Stocks
Here is a practical workflow for using the D/E ratio when you are evaluating a potential investment:
- Pull the balance sheet from the company’s latest annual report or a financial site like Macrotrends or Simply Wall St.
- Calculate the ratio using total liabilities and total equity.
- Compare it to the industry average to see if it is in a normal range.
- Look at the trend over the past 3 to 5 years. Is debt growing faster than equity? That is a warning sign.
- Check the interest coverage ratio to see if the company can comfortably pay interest on its debt.
- Read the notes in the annual report. Management often explains the reason for debt levels and future plans.
This process takes maybe 20 minutes per company. It can save you from investing in a business that looks healthy on the surface but is dangerously overleveraged underneath.
Common Mistakes When Using the Debt to Equity Ratio Formula
Avoid these errors that trip up even experienced analysts:
Comparing across industries. A D/E ratio of 2.0 is fine for a utility and alarming for a tech firm. Industry context is non-negotiable.
Ignoring off-balance-sheet liabilities. Some companies use operating leases, pension obligations, or special purpose vehicles that do not show up as traditional debt. These can significantly change your assessment.
Using it in isolation. The D/E ratio is one tool, not the whole toolbox. Combine it with profitability metrics, cash flow analysis, and growth rates.
Not adjusting for goodwill. Some analysts subtract goodwill and intangible assets from equity before calculating the ratio. This gives a more conservative and arguably more realistic picture.
Conclusion
The debt to equity ratio formula is one of the most useful and straightforward tools in financial analysis. You take total liabilities, divide by total shareholders’ equity, and instantly understand how a company is funded.
A lower ratio generally signals financial stability. A higher ratio can mean growth potential or dangerous leverage, depending on the industry and context. Neither is automatically good or bad.
The key is to use this ratio as part of a broader analysis. Combine it with cash flow data, industry benchmarks, and historical trends. That combination gives you a genuinely informed view of a company’s financial health.
So here is a question for you: have you ever calculated the debt to equity ratio for a company you invest in or work for? If not, try it today. Pull up the latest balance sheet, run the numbers, and see what you find. You might be surprised.
If you found this guide helpful, share it with someone who is trying to get better at reading financial statements.

Frequently Asked Questions
1. What is the debt to equity ratio formula? The debt to equity ratio formula is: Total Liabilities divided by Total Shareholders’ Equity. It measures how much a company relies on borrowed money compared to its own capital.
2. What is a good debt to equity ratio? It depends on the industry. Generally, a ratio below 1.0 is considered conservative and safe. Between 1.0 and 2.0 is moderate. Above 2.0 can signal higher financial risk, though capital-intensive industries often operate with higher ratios.
3. Where do I find the numbers to calculate the ratio? Both numbers come from the company’s balance sheet. Total liabilities and total shareholders’ equity are listed clearly in any annual or quarterly report.
4. Can the debt to equity ratio be negative? Yes. If shareholders’ equity is negative, the ratio will be negative. This usually happens when a company has accumulated heavy losses or done extensive stock buybacks. It is often a red flag.
5. How is the debt to equity ratio different from the debt ratio? The debt ratio compares total liabilities to total assets. The debt to equity ratio compares total liabilities to equity. Both measure leverage but from slightly different angles.
6. Do investors prefer a low or high debt to equity ratio? Most conservative investors prefer lower ratios because they signal less financial risk. However, some growth investors are comfortable with higher ratios if the company generates strong returns on that borrowed capital.
7. Is the debt to equity ratio formula the same for all industries? The formula is the same, but acceptable ranges differ by industry. Always benchmark against sector peers, not general rules.
8. How often should you check a company’s debt to equity ratio? At minimum, check it annually using the latest financial statements. For active investors or lenders, reviewing it quarterly is a good practice.
9. Can you use the debt to equity ratio formula for personal finance? Yes. Divide your total personal debt by your total net worth. The result gives you a sense of how leveraged your personal financial position is.
10. What other ratios should I use alongside the debt to equity ratio? Pair it with the interest coverage ratio (how easily can the company pay interest?), the current ratio (can it cover short-term obligations?), and return on equity (is it generating good returns from its equity base?). Together, these ratios give a much more complete financial picture.
Also Read In BusinessNile.co.uk
Email: johanharwen314@gmail.com
Author Name: Hamid Ali