Performance Analytics: Powerful Wins, Costly Mistakes to Avoid 2026

Introduction
You have data. Probably more than you can handle. But if you are making decisions based on gut feeling rather than what the numbers are actually telling you, you are leaving results on the table every single day.
Performance analytics is the practice of collecting, measuring, and interpreting data to understand how well your people, processes, or business are performing. It turns raw numbers into actionable insight. Done right, it helps you grow faster, cut waste, and make smarter calls at every level.
This article covers everything you need to know about performance analytics. You will learn what it is, why it matters, which metrics count, what tools to use, and what mistakes to avoid. Whether you are a business owner, a manager, a marketer, or an analyst, this guide gives you a clear framework to start using performance analytics more effectively right now.

What Is Performance Analytics and Why Does It Matter?
Performance analytics refers to the systematic use of data to measure and improve outcomes. It covers everything from employee productivity and sales conversion rates to website traffic and campaign ROI. At its core, it answers one question: are we doing well, and how can we do better?
The global analytics market was valued at over 240 billion USD in 2021 and continues to grow at a compound annual rate of around 13 percent. Businesses that use data-driven performance analytics are 23 times more likely to acquire customers and six times more likely to retain them, according to McKinsey research.
In simple terms, if you are not measuring performance, you are flying blind. Performance analytics gives you a cockpit full of instruments so you always know where you are headed.
Performance Analytics vs. Traditional Reporting
Many people confuse performance analytics with standard reporting. They are not the same thing. Traditional reporting tells you what happened. Performance analytics tells you why it happened and what to do next.
A sales report shows you last quarter’s revenue. Performance analytics shows you which team members drove that revenue, which channels converted best, and what actions are most likely to repeat that success next quarter. The difference is insight versus information.
The Key Components of Performance Analytics
To use performance analytics effectively, you need to understand its building blocks. These components work together to create a complete picture of performance.
1. Data Collection
You cannot analyze what you have not collected. Data collection is the foundation of all performance analytics work. This includes structured data from databases, CRM systems, and financial platforms, as well as unstructured data from social media, customer reviews, and emails.
Good data collection means capturing the right data at the right time. Garbage in equals garbage out. If your data is incomplete, inconsistent, or outdated, your analysis will mislead you.
2. Key Performance Indicators
KPIs are the specific metrics you use to measure success. Choosing the right KPIs is critical to effective performance analytics. Too many KPIs create noise. Too few leave blind spots. The best approach is to focus on a small set of metrics that directly connect to your most important goals.
Strong KPIs share these qualities:
- They are specific and measurable.
- They connect directly to a business goal.
- They can be tracked consistently over time.
- They drive meaningful action when they change.
3. Data Visualization
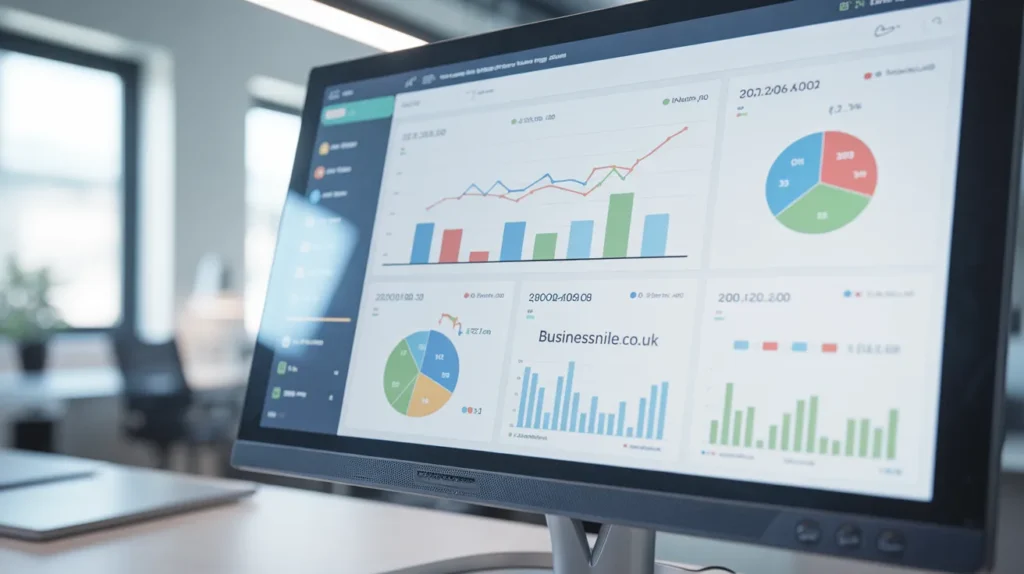
Raw numbers are hard to process quickly. Visualization transforms data into charts, dashboards, and graphs that make patterns visible at a glance. A well-designed performance analytics dashboard can help a team spot problems in seconds that might take hours to find in a spreadsheet.
Tools like Tableau, Power BI, and Google Looker Studio let you build live dashboards that update automatically. When your team can see performance data clearly, they make faster and better decisions.
4. Analysis and Interpretation
Collecting data and displaying it is only half the job. You also need someone with the skills to interpret it correctly. This is where performance analytics becomes a real competitive advantage. Skilled analysts can identify trends, correlations, and outliers that lead to genuine breakthroughs.
Interpretation requires context. A drop in website traffic might look alarming on a graph. But if it follows a spike caused by a viral post, it is actually normal. Context turns numbers into understanding.
Types of Performance Analytics You Should Know
Performance analytics is not one-size-fits-all. Different contexts call for different types of analysis. Here are the four main categories you need to understand.
Descriptive Analytics
This answers the question: what happened? Descriptive analytics summarizes historical data to show trends and patterns. Monthly sales summaries, website traffic reports, and employee attendance records all fall into this category.
Diagnostic Analytics
This answers: why did it happen? Diagnostic analytics digs deeper into data to find the causes behind the patterns. If your sales dropped last month, diagnostic analytics helps you figure out whether it was due to pricing, competition, seasonality, or something else entirely.
Predictive Analytics
This answers: what is likely to happen? Predictive performance analytics uses historical data and statistical models to forecast future outcomes. Retailers use it to predict demand. HR teams use it to predict employee turnover. Marketers use it to forecast campaign results.
Prescriptive Analytics
This answers: what should we do? Prescriptive analytics recommends specific actions based on data and models. It is the most advanced form of performance analytics and relies heavily on AI and machine learning to generate recommendations. Think of it as a GPS for your business strategy.
How to Build a Performance Analytics Framework That Actually Works
Many organizations collect data but never turn it into real improvement. The problem is usually not the tools. It is the framework. Here is a step-by-step process to build one that works.
- Define your goals clearly. Before you measure anything, know what you are trying to achieve. Vague goals produce vague insights. Specific goals, like increasing customer retention by 15 percent in six months, give your performance analytics a clear target.
- Choose your KPIs carefully. Map each KPI directly to a specific goal. Avoid vanity metrics that look impressive but do not drive decisions. Focus on leading indicators, those that predict future results, not just lagging ones that confirm what already happened.
- Set up your data infrastructure. Decide where your data lives, how it gets collected, and how different systems connect. Many businesses use a central data warehouse or a customer data platform to bring everything together.
- Build your dashboards. Create views that different teams actually need. An executive needs a high-level summary. A marketing manager needs channel-by-channel breakdowns. A customer service lead needs response time and satisfaction scores.
- Review and act on the data regularly. Schedule weekly or monthly performance reviews where your team looks at the data together, identifies what is working, and decides what to change. The value of performance analytics comes from acting on what you learn, not just watching the numbers.
- Iterate and improve. Your framework is never finished. As your business evolves, your metrics and processes should evolve too. Treat your performance analytics system as a living thing, not a one-time project.
Best Performance Analytics Tools for Teams of Every Size
The right tool depends on your goals, your budget, and your team’s technical skills. Here is a breakdown of the most widely used performance analytics platforms today.
For Business Intelligence and Reporting
- Tableau: Excellent for visual analytics and enterprise-level dashboards.
- Microsoft Power BI: Strong integration with Microsoft products, great for mid-sized businesses.
- Google Looker Studio: Free, cloud-based, and integrates well with Google products.
- Qlik Sense: Good for self-service analytics with strong data exploration features.
For Marketing Performance Analytics
- Google Analytics 4: Essential for website and app performance tracking.
- HubSpot: Strong for inbound marketing and sales pipeline analytics.
- Semrush: Excellent for SEO performance analytics and competitive benchmarking.
- Triple Whale: Growing favorite for ecommerce brands tracking multi-channel attribution.
For HR and Employee Performance Analytics
- Workday: Comprehensive HR analytics with workforce planning capabilities.
- BambooHR: User-friendly people analytics for small and mid-sized businesses.
- Visier: Specializes in workforce intelligence and organizational analytics.
For Sales Performance Analytics
- Salesforce Einstein Analytics: AI-powered sales analytics built into the Salesforce platform.
- Clari: Revenue intelligence platform with strong forecasting tools.
- Gong: Conversation intelligence that ties sales activity to revenue outcomes.
I have personally worked with teams that switched from spreadsheet-based tracking to a dedicated performance analytics platform and saw immediate gains in both speed and decision quality. The investment almost always pays off faster than people expect.
Costly Performance Analytics Mistakes You Need to Avoid
Even experienced teams make avoidable errors with performance analytics. These mistakes can waste time, mislead decisions, and damage trust in data across your organization.
Tracking Too Many Metrics
More data does not automatically mean better insight. When you track everything, nothing stands out. Teams that chase dozens of KPIs often end up paralyzed or confused. Pick fewer metrics and track them deeply. Aim for clarity, not completeness.
Ignoring Data Quality
Bad data is worse than no data. If your systems have duplicate records, missing values, or inconsistent formats, your analysis will lead you to wrong conclusions. Invest time in data hygiene before you invest in dashboards. Clean data is the most underrated element of strong performance analytics.
Focusing Only on Lagging Indicators
Lagging indicators like revenue and profit tell you what already happened. They are important, but they cannot help you get ahead of problems. Balance them with leading indicators like pipeline volume, customer satisfaction scores, and employee engagement that signal what is coming next.
Failing to Share Insights Across Teams
Performance analytics only creates value when people act on it. If your data lives in a silo and only the analytics team sees it, you are leaving most of the value on the table. Build a culture of data sharing. Make dashboards accessible. Encourage every team to ask questions of the data.
Not Linking Analytics to Decision-Making
The worst outcome is when a business invests heavily in performance analytics infrastructure but continues making decisions based on opinion and hierarchy rather than data. Analytics needs to be built into how decisions actually get made, not treated as a separate reporting exercise.
How Performance Analytics Works Across Different Industries
Performance analytics applies in virtually every sector. Here is how different industries use it to drive results.
Performance Analytics in Sports
Sports teams were early adopters of advanced performance analytics. Teams use player tracking data, biometric sensors, and historical match data to improve training, prevent injuries, and build better game strategies. The Moneyball story of the Oakland Athletics showed the world what was possible when you use analytics to challenge conventional wisdom.
Performance Analytics in Healthcare
Hospitals and health systems use performance analytics to monitor patient outcomes, reduce readmission rates, and manage resource allocation. Predictive models help flag high-risk patients before their condition worsens. According to Deloitte, healthcare organizations that adopt advanced analytics see significant improvements in both operational efficiency and patient care quality.
Performance Analytics in Marketing
Marketers rely on performance analytics to understand which campaigns drive real conversions, not just clicks. Attribution modeling, customer lifetime value analysis, and cohort tracking all help marketing teams spend smarter and scale what works. The brands winning today are those that treat marketing as a data science, not just a creative exercise.
Performance Analytics in Human Resources
HR teams use performance analytics to measure employee engagement, track retention patterns, identify high performers, and predict flight risks. Organizations with strong people analytics capabilities are better at hiring, developing, and keeping the talent they need to grow.
The Future of Performance Analytics: What Is Coming Next
Performance analytics is evolving rapidly. Several trends are shaping where it goes from here, and smart organizations are already preparing.
- AI and Machine Learning Integration: Automated analysis and real-time recommendations are replacing manual reporting cycles. AI-powered performance analytics tools can surface insights faster than any human analyst team.
- Real-Time Analytics: Businesses increasingly demand live data rather than weekly or monthly reports. Real-time performance analytics dashboards are becoming standard in fast-moving industries like ecommerce and finance.
- Augmented Analytics: Natural language processing lets non-technical users ask questions of their data in plain English and get instant answers. This democratizes performance analytics across entire organizations.
- Privacy-First Data Practices: As regulations like GDPR and CCPA tighten, performance analytics teams must find ways to gather meaningful insight while respecting user privacy. First-party data strategies are becoming essential.
- Embedded Analytics: Analytics is being built directly into the tools people already use, like CRMs, project management platforms, and communication apps, so insights arrive in context rather than requiring a separate system.
Conclusion: Start Using Performance Analytics Better Today
Performance analytics is not a luxury for large enterprises. It is a practical tool that any team, at any size, can use to make smarter decisions and get better results. The teams winning right now are the ones that measure what matters, act on what they find, and keep improving their approach over time.
The core lesson is simple. Data only creates value when it drives action. Invest in the right KPIs. Build clean, accessible dashboards. Review performance regularly. And most importantly, build a culture where decisions flow from evidence rather than assumption.
You now have a solid foundation to build or improve your performance analytics practice. Start with one clear goal, pick two or three KPIs that matter most, and build from there. You will be surprised how quickly good data changes the way your team thinks and operates.
Which part of performance analytics are you working on right now? Drop a comment below and share what is working for you. If you found this guide useful, send it to a colleague who could use a smarter approach to measuring results.

FAQs: Performance Analytics
1. What is performance analytics in simple terms?
Performance analytics is the process of using data to measure how well something is working and find ways to improve it. It applies to businesses, sports teams, marketing campaigns, employees, and more.
2. Why is performance analytics important for businesses?
It helps businesses make faster, smarter decisions based on real data instead of guesswork. Companies that use performance analytics consistently outperform those that rely on intuition alone, with better customer acquisition, retention, and operational efficiency.
3. What are the most important KPIs in performance analytics?
It depends on your goals. Common high-value KPIs include customer acquisition cost, customer lifetime value, employee productivity, conversion rate, net promoter score, and revenue per user. The best KPIs are those tied directly to your most critical business objectives.
4. What tools do I need to get started with performance analytics?
You can start simply with Google Analytics for website data and Google Looker Studio for visualization. As your needs grow, platforms like Tableau, Power BI, Salesforce, or HubSpot offer more advanced performance analytics capabilities.
5. How is performance analytics different from business intelligence?
Business intelligence focuses on describing what happened using historical data. Performance analytics goes further by diagnosing why it happened, predicting what comes next, and recommending what to do about it. Think of BI as the foundation and performance analytics as the full structure built on top.
6. Can small businesses use performance analytics?
Absolutely. You do not need a large budget or a data science team to benefit from performance analytics. Free tools like Google Analytics, Google Looker Studio, and basic CRM reporting give small businesses powerful insights without significant cost.
7. How often should I review performance analytics data?
It depends on the metric. Some data, like ad spend performance, needs daily review. Others, like employee satisfaction or quarterly revenue trends, make more sense to review monthly or quarterly. Build a rhythm that matches the pace of decisions your team makes.
8. What is the biggest mistake companies make with performance analytics?
Collecting data without acting on it. Many businesses invest in tools and dashboards but never build the habits and processes needed to use the insights. The technology is only as valuable as the decisions it informs.
9. How does AI improve performance analytics?
AI automates pattern recognition, surface anomalies faster than humans can, and generates predictive models at scale. Modern AI-powered performance analytics tools can deliver real-time recommendations that used to require weeks of manual analysis.
10. What skills do I need to work in performance analytics?
Core skills include data literacy, statistical thinking, familiarity with analytics tools like SQL, Excel, or Python, and strong communication skills to translate data into business decisions. You do not need to be a developer, but comfort with numbers and a curious mindset are essential.
Also Read BusinessNile.co.uk
Email: ha458545@gmail.com
Author name: Hamid Ali
About the Author: Johan Harwen is a business writer and data strategy consultant with more than ten years of experience helping organizations make smarter decisions through performance analytics. He has worked with startups, mid-market companies, and enterprise teams across industries including technology, retail, and healthcare.